Only 3% of Roofing Websites Score Above 80 — What the Top Performers Do Differently
Out of 1,409 audited roofing sites, only 42 scored above 80/100. Here's the pattern that separates them from the 97% falling short.
A roofing company in Austin scored 87 out of 100 on our Website Quality Index. A competitor three miles away scored 19. Both have 5-star Google reviews. Both have been in business for over a decade. Both run Google Ads.
One gets calls from the website. The other pays $187 per lead and wonders why the phone doesn’t ring.
When we audited 1,409 roofing websites across Texas, Florida, and Georgia, only 42 sites — roughly 3% — scored above 80. These sites aren’t built by expensive agencies. They don’t use cutting-edge technology. But they share a pattern that the other 97% consistently miss.
The Score Distribution Tells the Story
Most roofing websites cluster in the 30-60 range. The distribution isn’t a bell curve — it’s a cliff. A massive group of mediocre sites, a thin layer of decent ones, and a tiny handful that actually convert.
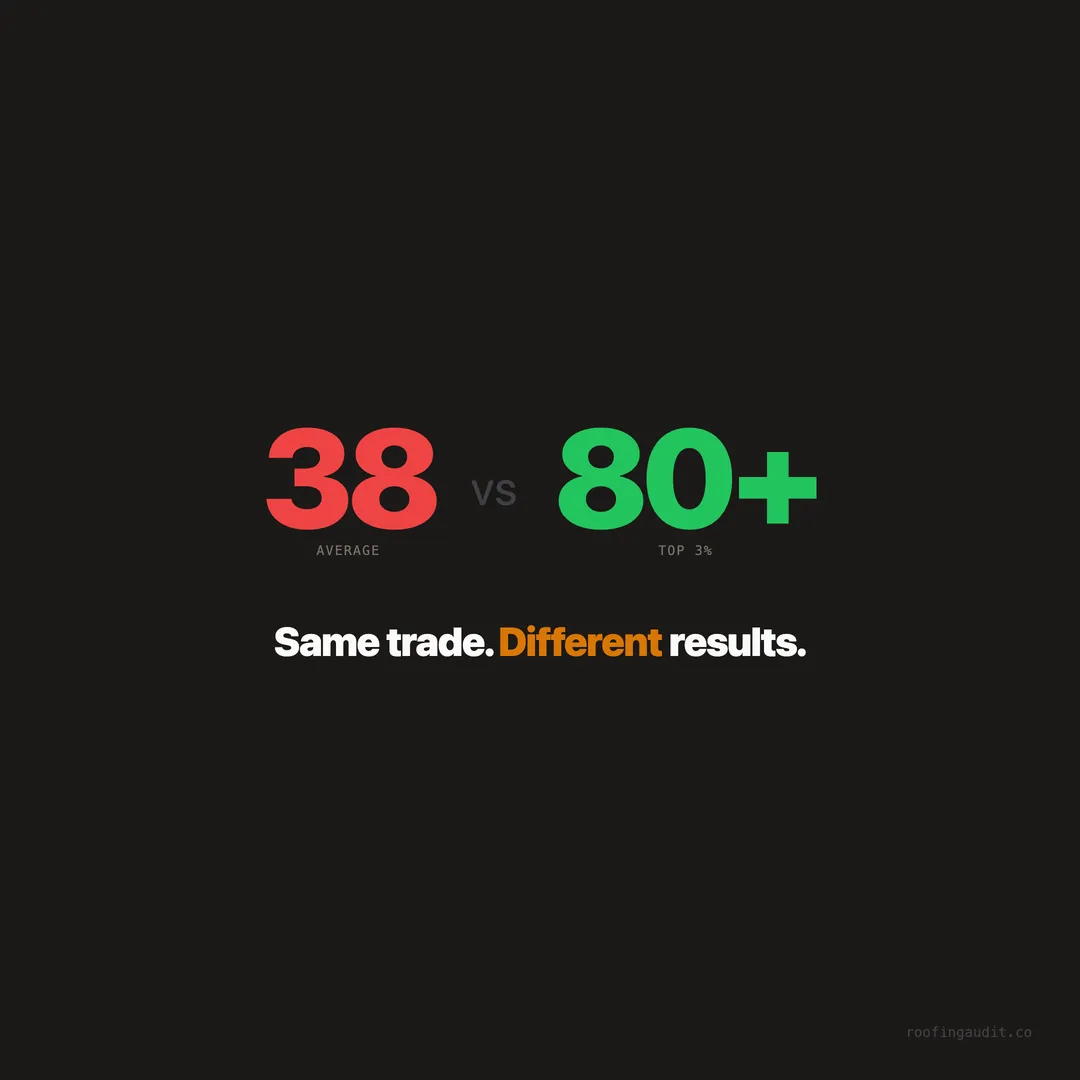
The peak sits between 35 and 45 — meaning the average roofing website is missing roughly a third of the elements that generate leads. The full audit breakdown covers all 15 gap categories.
The 7 Elements Every Top-Scoring Site Has
We pulled the 42 sites scoring 80+ and compared them against the bottom third. The differences aren’t subtle. Every single top performer has these seven elements. Most bottom-tier sites have two or fewer.
A Storm Damage Gallery With Real Project Photos
Not stock images. Not renderings. Actual before-and-after photos from jobs they’ve completed — labeled by city, roof type, and damage cause.
31% of all sites we audited have no storm damage gallery at all. Among the top 3%, it’s zero percent — every single one has a gallery. In Texas (529 hail events in 2024) and Florida ($25 billion in hurricane losses), visual proof isn’t optional. It’s the first thing homeowners look for.
The best galleries include 15-30 projects, organized by damage type (hail, wind, age) with short descriptions: “3,200 sq ft asphalt shingle replacement in Plano, TX — hail damage, insurance-approved."
"Free Estimate” or “Free Inspection” Above the Fold
Every top-scoring site puts the CTA where it can’t be missed — above the fold on desktop and mobile. No scrolling required. No hunting for a contact page.
The language matters too. “Free Estimate” outperforms “Contact Us” because it removes financial risk. On an $8,000 to $25,000 purchase, the word “free” does heavy lifting.
31% of audited sites have no clear estimate CTA. The cost of burying that CTA is measurable — and it’s the easiest fix in this entire list.
Manufacturer Certifications Displayed Prominently
Only 2% of roofers earn GAF Master Elite. Less than 1% become Owens Corning Platinum Preferred. These are hard to get and expensive to maintain.
Yet 30% of sites don’t display any certifications at all. Among the top 3%, every site displays their certifications with logos — not just text mentions. GAF, Owens Corning, and CertainTeed logos appear in the hero section, the footer, and the about page.
When a homeowner is comparing three quotes, certifications are the tiebreaker. They’re proof that a manufacturer trusts this contractor with their brand.
An Insurance Claim Guide
In Florida, 42% of hurricane insurance claims were denied in 2024. Homeowners are confused and anxious. The roofer who explains the process wins the trust — and the job.
Top-scoring sites have a dedicated insurance claim page that walks homeowners through filing, documentation, adjuster meetings, and what the roofer handles vs. what the homeowner handles. Some include a downloadable checklist.
30% of sites we audited have zero insurance content. In storm states, that’s a lead magnet left on the table.
An Emergency Repair / Tarping Page
When a tree falls through a roof at 2 AM, the homeowner doesn’t research contractors. They grab their phone and call the first roofer who looks like they handle emergencies.
Every top-scoring site has a dedicated emergency repair page with a clickable phone number, response time promise (“on-site within 2 hours”), and photos of tarping work. 30% of all sites have no emergency page at all.
Schema Markup
This is invisible to homeowners — but critical for Google. RoofingContractor or LocalBusiness schema tells Google exactly what the business does, where it operates, its hours, phone number, and service types.
31% of sites have no schema markup. Among the top 3%, every site has it. The fix takes 5 minutes with a single JSON-LD code block, yet most roofers don’t know it exists.
Quantified Social Proof
Not just “trusted by homeowners.” Specific numbers: “3,200 roofs installed” or “serving Dallas since 2007” or “4.9 stars across 680 reviews.”
31% of sites have no quantified social proof. Top performers put numbers everywhere — hero section, about page, footer, service pages. Numbers build credibility faster than adjectives.
What the Bottom 30% Look Like
Sites scoring below 30 share their own pattern — and it’s almost the inverse:
- Stock photos instead of real project work
- “Contact Us” instead of “Free Estimate”
- No certifications visible anywhere
- No insurance content — in storm states
- No emergency page — they lose every after-hours lead
- No schema — invisible to Google’s local algorithms
- Generic claims like “quality workmanship” with no numbers to back them up
These sites look interchangeable. Homeowners can’t tell one from another. And when everything looks the same, the decision defaults to whoever shows up first on Google — which requires the SEO and trust signals these sites are missing.
The Gap Is Fixable in Days, Not Months
The distance between a 30-score site and an 80-score site isn’t a redesign. It’s not a $15,000 agency project. It’s a focused week of work:
| Fix | Time | Impact |
|---|---|---|
| Add storm damage gallery (15-20 photos) | 1 day | High — visual trust |
| Move “Free Estimate” above the fold | 1 hour | High — immediate conversion lift |
| Add manufacturer certification logos | 2 hours | High — trust tiebreaker |
| Write insurance claim guide | Half day | Medium-High — lead magnet |
| Add emergency repair page | Half day | High — captures after-hours leads |
| Add schema markup (JSON-LD) | 30 minutes | Medium — local SEO visibility |
| Add quantified social proof | 1 hour | Medium — credibility signal |
Total: 3-4 days of focused work. That’s the difference between the top 3% and everyone else.
The 34-point roofing website checklist turns these findings into an actionable scorecard you can use on your own site today.
Your Competitors Already Know This
The uncomfortable reality: while you’re reading this, some of your competitors have already fixed these gaps. They’re getting the calls you’re missing — not because they’re better roofers, but because their website communicates trust 3 seconds faster than yours.
The data from 1,409 roofing websites is clear. The top 3% aren’t doing anything revolutionary. They’re just doing the basics — and doing them visibly.
The roofers capturing the most leads online aren’t the ones with the best trucks or the biggest crews. They’re the ones whose websites prove it before anyone picks up the phone.
Keep reading
Want to know your score?
Drop your URL — full report in 48 hours.
We're on it.
Report in your inbox within 48 hours.