How Your Roofing Website Stacks Up Against Competitors
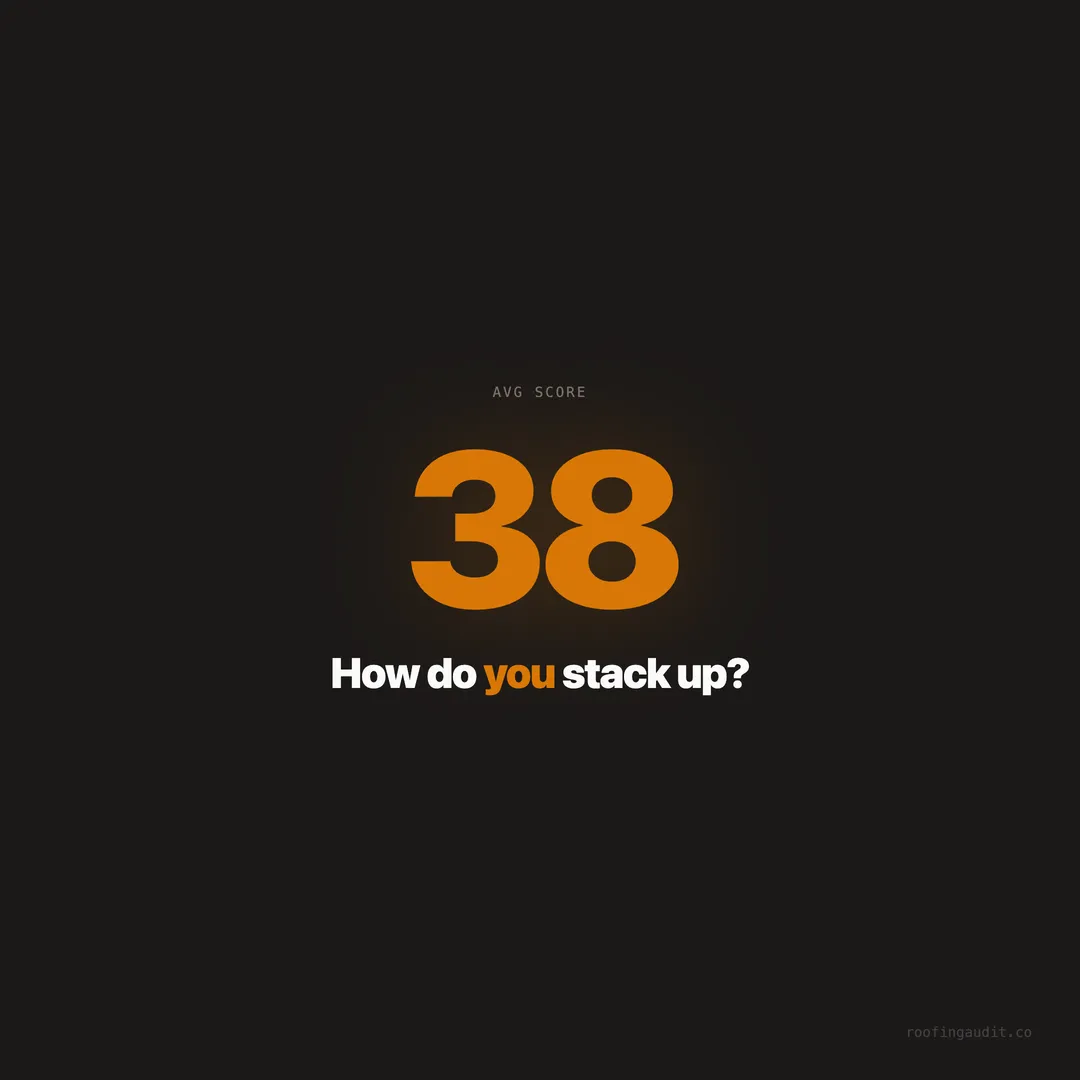
Score your roofing website against benchmarks from 1,409 audited sites. The average roofer misses 32% of what generates leads — where do you rank?
You think your roofing website is fine. It has your phone number, a list of services, maybe a few project photos. It looks professional enough. But “fine” doesn’t generate leads — and your competitors who are booking full schedules aren’t settling for fine.
When we audited 1,409 roofing websites across Texas, Florida, and Georgia, we scored every site against 34 lead-generating elements. The average site was missing 32% of those elements. The top 3% of sites had nearly all of them. The bottom 30% were missing half or more.
The gap between a website that generates leads and one that doesn’t isn’t design taste. It’s structural. Specific pages, specific CTAs, specific content — either you have them or you don’t. And right now, you can find out exactly where you stand.
The Self-Audit Framework
Below is the scoring framework we used across all 1,409 sites. Grade yourself honestly on each element. No one’s watching — but your competitors are winning leads while you’re guessing.
Category 1: Trust and Credibility (25 points)
These elements determine whether a visitor believes you’re legitimate within the first 3 seconds of landing on your site. The 3-second test is real — homeowners decide that fast.
| Element | Points | % of Sites Missing It |
|---|---|---|
| Google reviews displayed on site | 5 | 28% |
| Manufacturer certifications (GAF, Owens Corning, etc.) | 5 | 30% |
| License and insurance info visible | 5 | 33% |
| BBB or trade association badges | 5 | 37% |
| Years in business prominently stated | 5 | 25% |
Your score: ___ / 25
A site missing all five trust signals scores zero in the category where it matters most. A homeowner comparing three roofers will choose the one that proves credibility before asking for it. 72% of sites in our audit were missing at least one of these elements.
Category 2: Conversion Architecture (25 points)
These are the elements that turn visitors into leads. Without them, traffic is meaningless — whether that traffic comes from Google Ads at $187/lead or organic search.
| Element | Points | % of Sites Missing It |
|---|---|---|
| ”Free Estimate” CTA above the fold | 5 | 31% |
| Phone number clickable on mobile | 5 | 18% |
| Contact form on every service page | 5 | 42% |
| Emergency/after-hours number | 5 | 35% |
| Service area clearly defined | 5 | 27% |
Your score: ___ / 25
The free estimate CTA gap is the most damaging. 31% of roofing sites don’t tell visitors what to do next. The visitor arrived ready to act — and the website gave them no clear path.
Category 3: Content Depth (25 points)
Content isn’t just for SEO. It’s how homeowners evaluate whether you understand their specific problem — whether that’s storm damage, insurance claims, or choosing between repair and replacement.
| Element | Points | % of Sites Missing It |
|---|---|---|
| Storm damage gallery with local projects | 5 | 31% |
| Insurance claim content/guide | 5 | 30% |
| Individual pages per service (not just a list) | 5 | 38% |
| Blog with educational content | 5 | 45% |
| Financing information page | 5 | 41% |
Your score: ___ / 25
45% of roofing sites have no blog content at all. That means nearly half of all roofers are invisible for every informational search query — “how to tell if my roof needs replacement,” “cost of roof repair in [city],” “hail damage vs normal wear.” Each of those queries is a homeowner researching before they buy.
Category 4: Technical Performance (25 points)
Technical factors determine whether Google surfaces your site — and whether visitors stay once they arrive. 68% of roofing leads start on mobile, making mobile performance non-negotiable.
| Element | Points | % of Sites Missing It |
|---|---|---|
| Mobile-responsive design | 5 | 12% |
| Page load under 3 seconds | 5 | 58% |
| Schema markup (LocalBusiness + Service) | 5 | 31% |
| SSL certificate (HTTPS) | 5 | 8% |
| Google Business Profile linked/consistent | 5 | 22% |
Your score: ___ / 25
58% of roofing sites load in more than 3 seconds. On mobile, a site that takes 5 seconds to load loses 38% of visitors before they ever see the content. You could have perfect trust signals, a great CTA, and deep content — and still lose the lead because the site was too slow.
How to Score Yourself
Add up your points across all four categories. Your total out of 100 tells you where you stand:
80-100: Top 3%. Your website is a lead generation machine. You’re likely generating organic leads consistently. Focus on content expansion and maintaining performance. You’re doing what the best roofers do.
60-79: Above average. You’re ahead of most competitors, but specific gaps are costing you leads. Identify the missing elements and fix them — each one you add moves the needle.
40-59: Average. This is where 48% of roofing websites land. You have the basics but you’re missing enough that competitors with better sites are capturing leads you should be getting. The 34-element checklist shows exactly what to add.
20-39: Below average. Major structural gaps. You’re likely dependent on paid leads because the website isn’t capable of generating organic traffic. Priority: fix conversion architecture (CTAs, forms, phone) before anything else.
0-19: Critical. The website is costing you business. Every visitor who lands on it and bounces is a lead your competitor captured instead. Consider whether a redesign is needed or whether targeted fixes can bring the score up.
City-by-City Benchmarks
Not every market is the same. The city benchmarks from our audit reveal significant differences:
Dallas-Fort Worth: Average score 56/100. This market is competitive — multiple large roofers have invested in their websites. If you’re below 56, you’re behind the local average. Storm damage content is especially important here due to Texas hail frequency.
Houston: Average score 51/100. Slightly below the national average, but the market is huge. Lower competition per capita means a well-optimized site can capture disproportionate market share. Hurricane and hail content are both relevant.
Tampa: Average score 54/100. Florida’s insurance complexity means insurance claim content is weighted heavily. Roofers with insurance guides outperform those without by a wider margin here than in any other market.
Miami: Average score 48/100. Surprisingly low for a major market. Many roofers in Miami rely heavily on word-of-mouth and drive-by marketing, underinvesting in their websites. This creates opportunity — a well-optimized site in Miami faces less competition than you’d expect.
Atlanta: Average score 53/100. Growing market with increasing competition. Service-area pages are especially important here, where metro sprawl means homeowners search by suburb, not just “Atlanta.”
Jacksonville: Average score 49/100. Below average scores across the board, particularly in technical performance. Roofers here can leapfrog competitors with basic optimization.
The Competitor Gap Analysis
Knowing your score is step one. Understanding how you compare to your direct competitors is step two. Here’s how to run a basic competitor analysis:
Identify your top 5 local competitors. Search “roof replacement [your city]” on Google. The top 3 organic results and top 2 map pack results are your primary competition.
Score each competitor on the same 34 elements. Visit their websites. Do they have a free estimate CTA above the fold? Storm damage gallery? Insurance content? Blog? Fast mobile load time? Score them honestly.
Map the gaps. If three of your five competitors have insurance claim content and you don’t, that’s a gap that’s actively costing you leads. If none of them have emergency repair pages, that’s an opportunity to differentiate.
Prioritize by impact. Fix the elements that your competitors have and you don’t first — these are the gaps most likely to explain why they’re getting leads you’re not. Then build the elements nobody has — these create competitive advantages.
The roofers who do this analysis systematically — not once, but quarterly — are the ones who maintain top-tier scores over time. The competitive landscape changes. Competitors add content. New roofers enter the market. Your website needs to keep pace.
What the Top 3% Have That You Don’t
The top 3% of roofing websites in our audit — scoring 80+ out of 100 — share seven characteristics that separate them from everyone else:
Every service has its own page. Not a bullet list under “Services.” Dedicated pages for roof replacement, roof repair, storm damage repair, commercial roofing, gutter installation, and emergency repairs. Each page targets specific search queries and contains unique content.
The CTA is everywhere and obvious. A “Free Estimate” or “Schedule Inspection” button appears above the fold on every page — not just the homepage. The phone number is clickable on mobile. Contact forms are on every service page.
Real project photos dominate. Not stock photos. Real before-and-after images of local projects, with captions that mention the neighborhood, material used, and project scope. A homeowner seeing their own neighborhood in the gallery is 3x more likely to call.
Content answers specific questions. “How much does a roof replacement cost in [city]?” “Does insurance cover hail damage?” “How long does a roof replacement take?” Each question is a page or section that captures search traffic.
Technical performance is strong. Pages load in under 2 seconds. Mobile experience is smooth. Schema markup tells Google exactly what the business does and where it operates. These sites don’t just look good — they perform.
Insurance and storm content is deep. Not surface-level mentions. Full guides on the insurance claim process, storm damage documentation, and what to expect from adjusters. This content captures the highest-intent leads in roofing.
The site feels local. City-specific content, local project photos, neighborhood references, and community involvement signals. These sites feel like they belong to the market — not like a template applied to a random roofing company.
Quick Wins That Move the Score Fastest
If you scored below 60, here are the five changes that move the needle fastest, based on what we saw across 1,409 sites:
1. Add a “Free Estimate” CTA above the fold on every page. This single change improves conversion rate more than any other. Make it a button. Make it contrast with the page background. Make it say exactly what happens next: “Get Your Free Estimate” or “Schedule Free Inspection.”
2. Make your phone number clickable on mobile. 68% of roofing leads start on mobile. If your phone number is an image or unlinked text, mobile users can’t tap to call. Wrap it in a tel: link. This is a 5-minute fix that directly impacts lead volume.
3. Add 10 real project photos with captions. Stock photos don’t convert. Real before-and-after photos of local projects — with captions noting the neighborhood, roofing material, and project type — build trust faster than any testimonial.
4. Create an insurance claim page. 30% of roofers are missing this. A single page explaining the claims process captures search traffic from homeowners who already have damage and already have insurance. These are the highest-intent leads in roofing.
5. Fix page speed. Use Google PageSpeed Insights. Compress images. Remove unused scripts. Enable browser caching. Getting below 3 seconds on mobile prevents the 38% bounce rate that slow sites experience.
Your Competitors Are Already Doing This
The roofers booking full schedules aren’t doing anything mysterious. They’re checking boxes that you’re leaving unchecked. The state of roofing websites in 2026 shows clear patterns: the companies investing in their websites are growing, and the companies treating their websites as afterthoughts are spending more and more on paid leads just to stay afloat.
Score your site. Find the gaps. Fix the gaps. Then score again.
The 1,409-site benchmark is your measuring stick. The 34-element checklist is your roadmap. And the roofers who act on this — rather than assuming their website is “fine” — are the ones who’ll be fully booked when storm season hits.
Keep reading
Want to know your score?
Drop your URL — full report in 48 hours.
We're on it.
Report in your inbox within 48 hours.